Amazon Vs. Walmart: Revenue And Profit Comparison, 2010–2024
Walmart is the largest US retailer overall, while Amazon dominates online retail. Over the past several years, Amazon’s revenue growth has significantly outpaced Walmart’s, and its profits have also surged. To understand the factors behind these trends, we analyzed their revenues and profits across business segments, geographic regions, and product/service categories.
NOTE: For our analysis, we examined the most recent annual financials of both companies. Amazon’s fiscal year (FY) ends in December, meaning its 2023 revenues represent the 12 months ending on December 31, 2023. Walmart’s fiscal year ends in January, so its FY24 revenues correspond to the 12 months ending on January 31, 2024. Since 11 of those 12 months fall within 2023, we compared Walmart’s FY24 revenues with Amazon’s 2023 revenues.
Following are three select insights from our analysis:
- Amazon’s growth far outpaces Walmart and the retail sector.
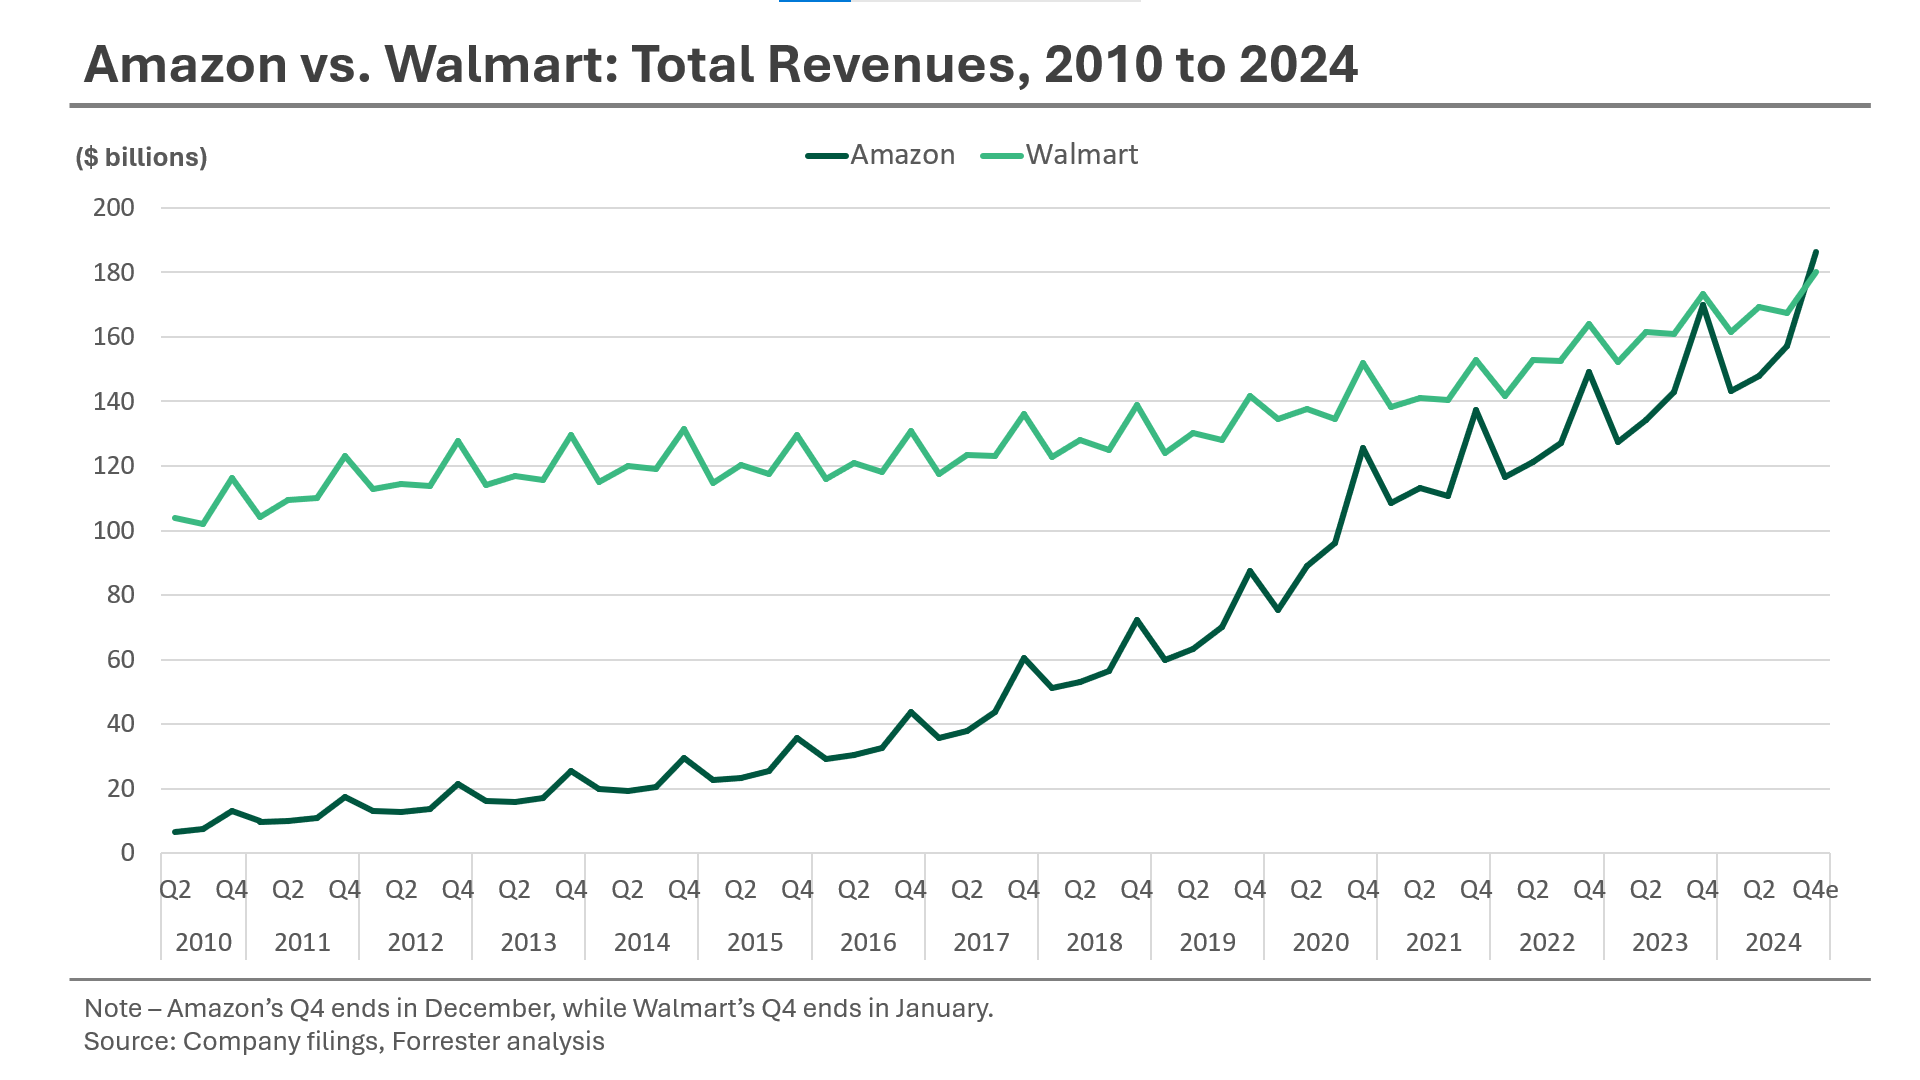
Amazon annual revenues reached $575 billion in 2023, and Walmart total revenues reached $648 billion. Over the last five years (2018–2023), Amazon achieved a cumulative annual growth rate (CAGR) of 20%, significantly outpacing both Walmart’s 5% growth and the 7% growth in total US retail sales (excluding auto and gas). Extending the analysis to a 13-year period (2010–2023), Amazon’s CAGR stood at an impressive 24%, compared to 3% for Walmart and 5% for the broader US retail industry.
In Q4 2024, Amazon’s quarterly revenues could surpass Walmart’s for the first time. For context, in Q1 2010, Amazon’s quarterly revenues were a modest $7 billion compared to Walmart’s $100 billion. Over the next decade, however, Amazon experienced rapid growth, fueled by its expansion into new markets and services. In Q4 2024, consensus estimates project Amazon’s quarterly revenues to reach $186 billion, narrowly surpassing Walmart’s expected $180 billion (see figure below).
- Amazon widens the net income gap with Walmart.
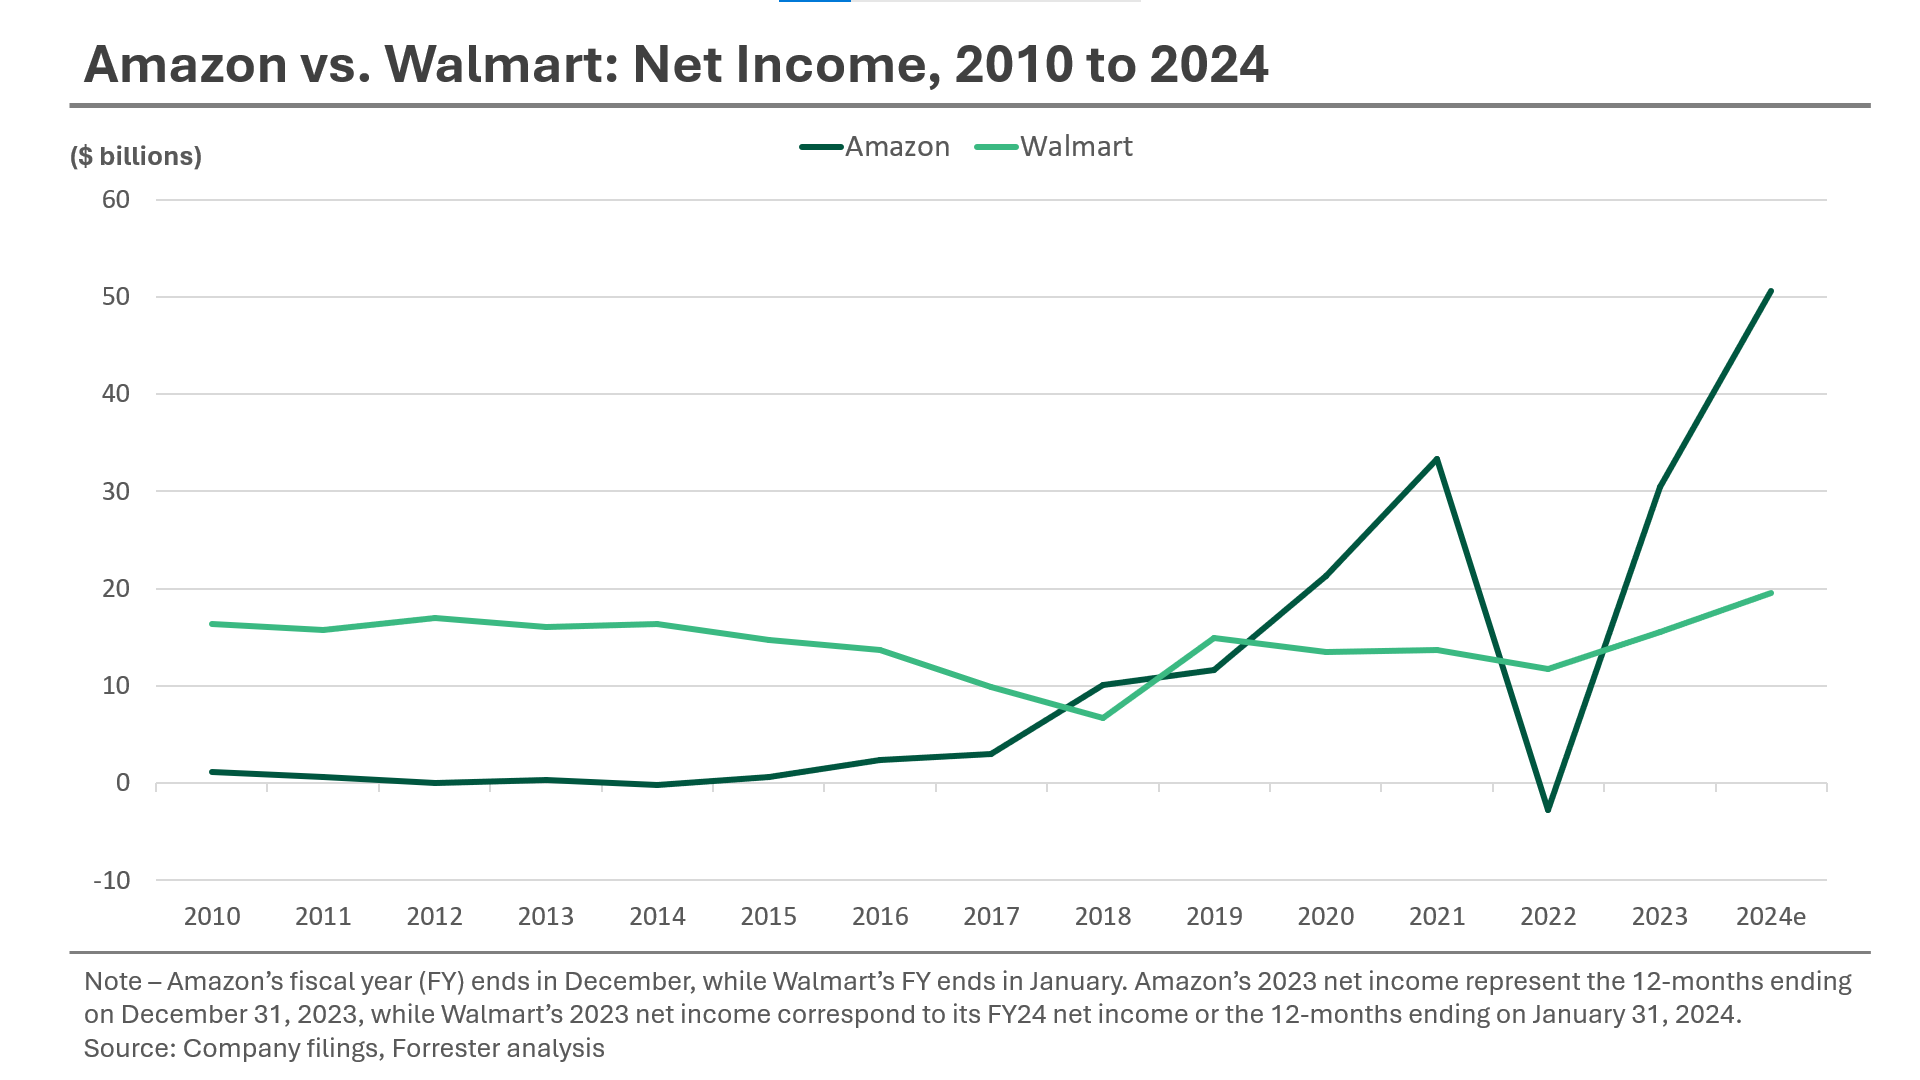
Amazon continues to outpace Walmart in net income. The consensus estimates project Amazon’s net income rising to $51 billion in 2024, up from $30 billion in 2023, with its net profit margin increasing to 8% from 5% (see figure below).
In comparison, Walmart’s net income will grow steadily, reaching $20 billion in FY25 with a 3% margin, up from $16 billion (2% margin) in FY24.
Wall Street analysts expect the net income gap between the two companies to keep widening, driven by Amazon’s profitability gains in Amazon Web Services (AWS) and its retail media operations. The consensus estimates project Amazon’s net income to increase to $63 billion in 2025 and $79 billion in 2026, compared to Walmart’s projected net income of $22 billion in 2025 and $24 billion in 2026.
- Walmart’s retail is profitable, but AWS greatly boosts Amazon’s overall profits.
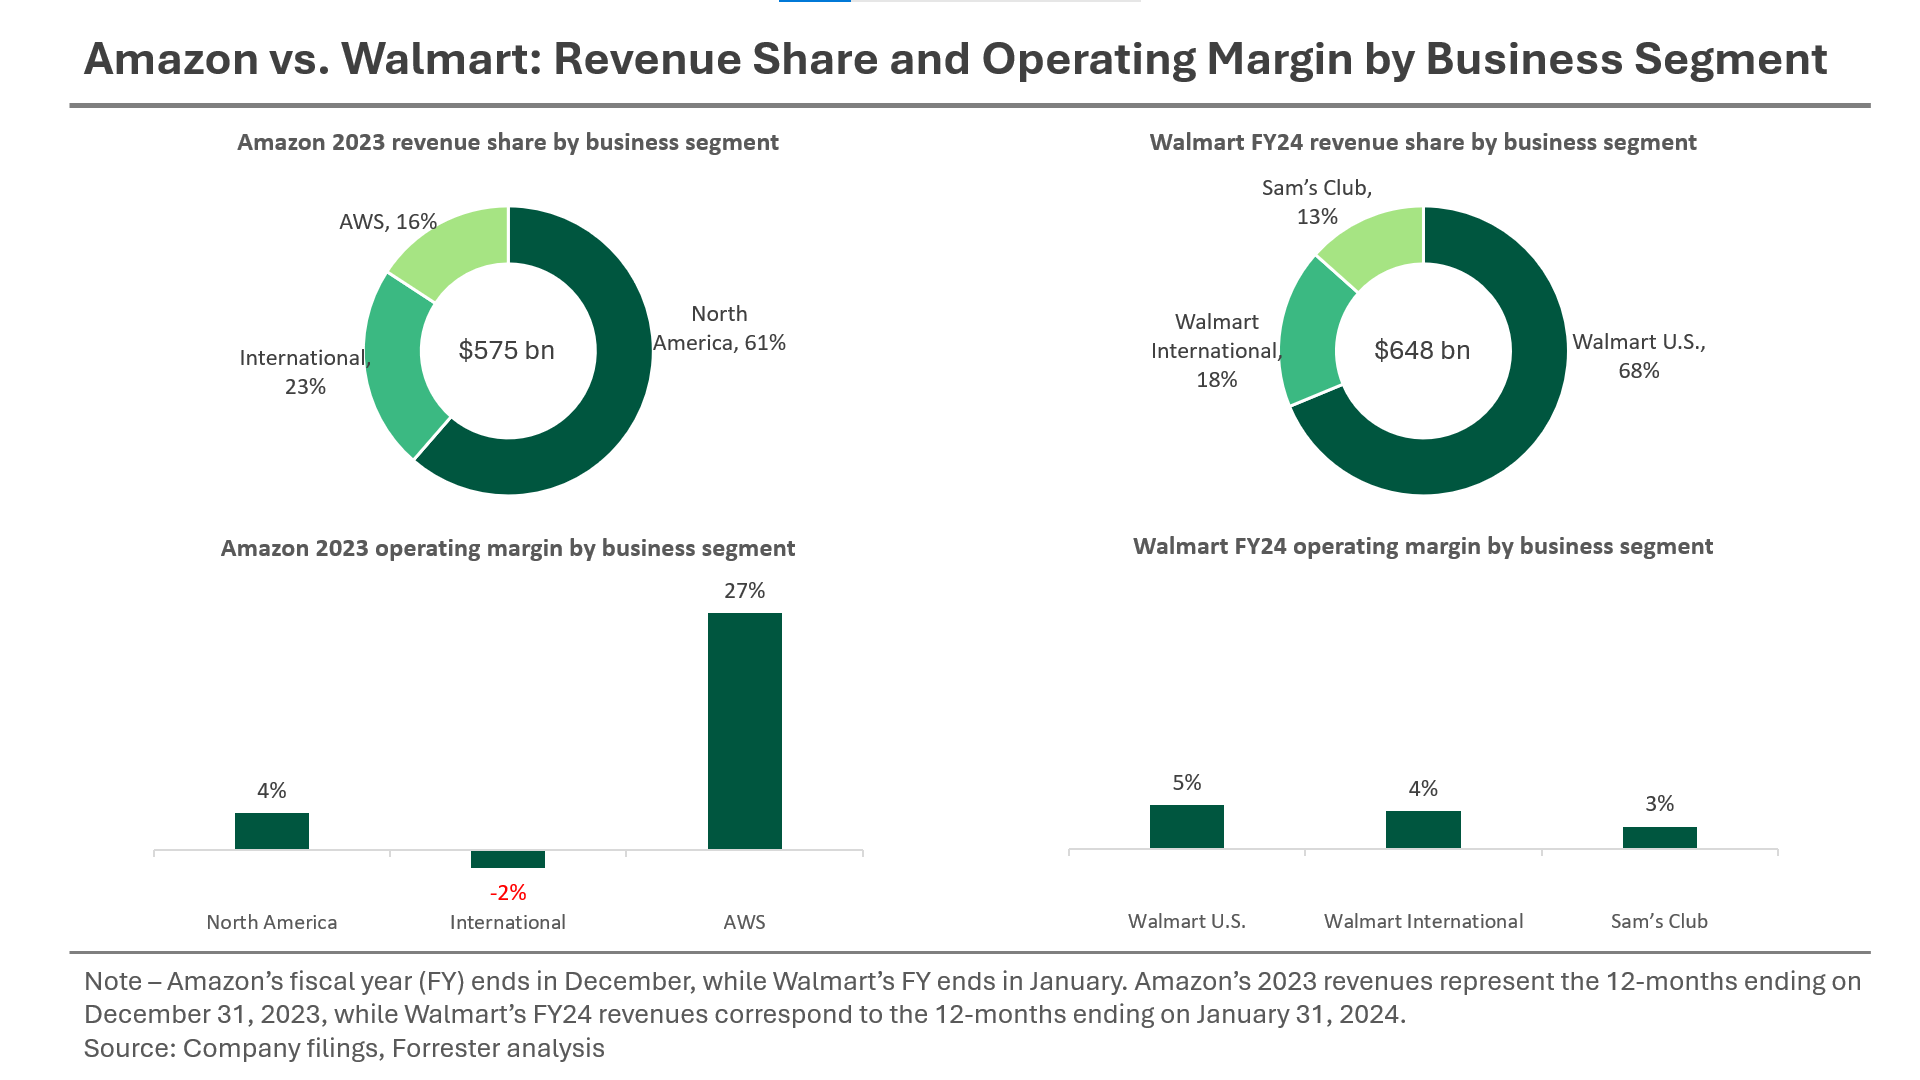
Amazon reports revenues and operating profits for three business segments: North America, international, and AWS. In 2023, Amazon’s North America segment generated $353 billion (61% of total revenue). The international segment contributed $131 billion (23%) and AWS added $91 billion (16%). Amazon reported AWS as a business segment for the first time in 2015, when it generated $8 billion in revenue for the company.
As for operating profits and margins: In 2023, Amazon’s North America segment generated $15 billion in profit (4% margin). Its international segment incurred a $3 billion loss (-2% margin), while AWS generated $25 billion in profit (27% margin) (see figure below).
Walmart’s three business segments are: Walmart U.S., Walmart International, and Sam’s Club. In FY24, Walmart U.S. brought in $442 billion (68% of total revenue), followed by Walmart International at $115 billion (18%) and Sam’s Club at $86 billion (13%).
Walmart’s operating profit and margins are more consistent: Walmart U.S. generated $22 billion in operating profit (5% margin), Walmart International $5 billion (4% margin), and Sam’s Club $2 billion (3% margin).
Forrester expects a continued shift in retail market share toward Amazon and Walmart over the next five years as both companies invest in artificial intelligence and machine learning, automation and customer experience, and growing alternative sources of revenues and profits such as retail media. As the two companies compete fiercely for higher sales growth, smaller competitors will struggle to keep up due to the strong balance sheets, pricing power, and technology capabilities of these giants. Smaller retailers will need to achieve significant differentiation in terms of service, assortment, and store/online experience.
Per Forrester’s US Online Retail Forecast, 2024 To 2029, the combined US retail sales of Amazon and Walmart will reach $1.5 trillion by 2029, capturing one-fourth of the total US retail market. By 2029, the combined US e-commerce sales of the two companies will reach $1.1 trillion, accounting for two-thirds of total US online retail sales.
If you are a Forrester client and would like to learn more, please schedule an inquiry or guidance session with me!