NPS: Most Industries Should Focus On Eliminating Detractors To Boost Growth
Are you a customer experience (CX) leader at a company using Net Promoter Score℠ (NPS)? Then you must be the most knowledgeable person on exactly how a change in NPS affects your organization’s key business metrics. Only then can you answer these critical questions:
Where should you focus?
-
- Will you focus on CX improvements that remove pain points to reduce the number of detractors?
- Will you focus on designing new and differentiating experiences that may help you gain more promoters? Or both?
- Should you focus on turning strong detractors into moderate ones?
How do you set better targets?
-
- How high should your NPS goal be?
- Have you reached a natural ceiling — aka, a higher goal isn’t worth it because the resulting lift in business metrics is negligible compared to the investments needed to achieve it?
- Should you only set a goal for the score itself, or do you need more granular targets (for example, for the share of promoters or detractors)?
Our Monetary-Impact Calculator Models Seven Scenarios Of How NPS Drives Growth
To help you do that, we just published The Business Impact Of Improving NPS: Nine Of 11 Industries Should Eliminate Detractors. For more info on the methodology, scroll down to the end.
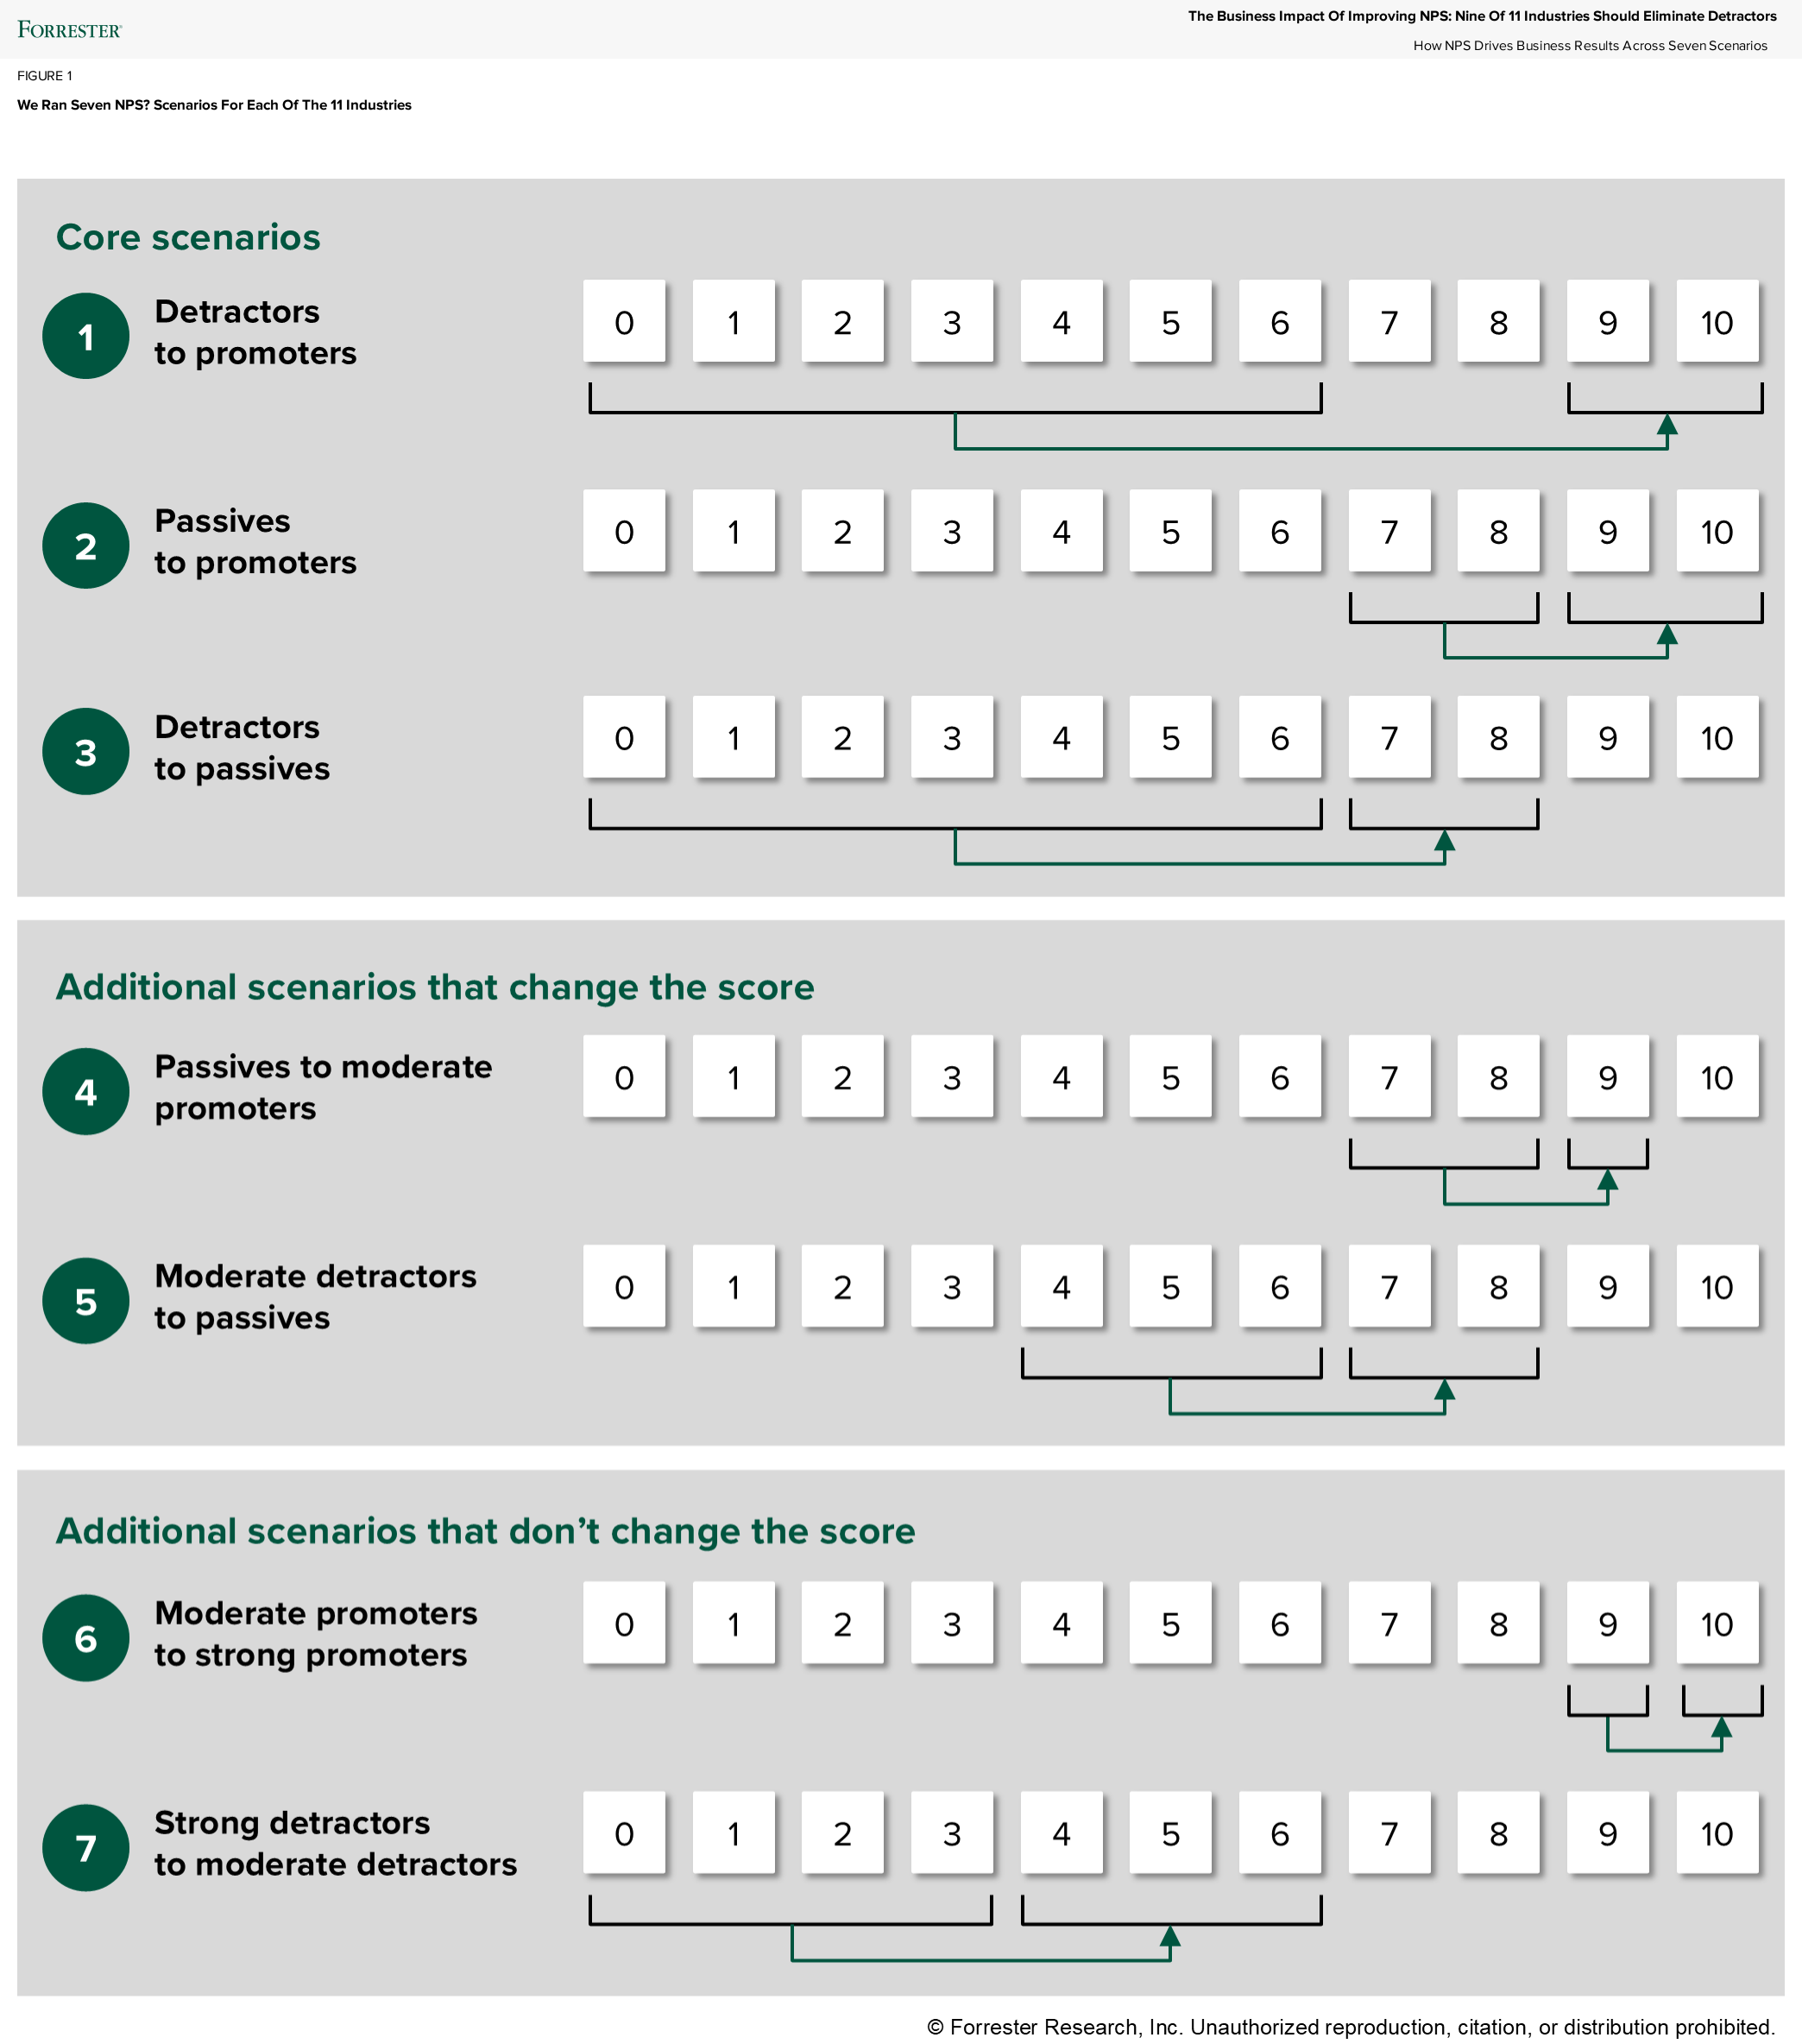
The report shows the detailed results of our analysis into how NPS drives business growth in seven scenarios. Five of those scenarios change the score and two of them don’t (the below graphic shows the scenarios). In our analysis, we:
- Derived a revenue potential for each customer. We combined NPS data and data on behavior intentions across 2022–2024 from our Customer Experience Benchmark Surveys with external data. Using that, we derived a revenue potential for each customer for all industries. The exception is investment firms, for which we modeled an assets-under-management potential.
- Calculated an average revenue potential for NPS categories and subcategories. Using our revenue potential numbers, we calculated an average revenue for the NPS categories (promoters, passives, and detractors). We then did the same for NPS subcategories (strong and moderate detractors, and strong and moderate promoters).
- Calculated a baseline revenue for each industry. For each industry, we multiplied the current share of customers per NPS (sub)category with the revenue potential of a customer in that (sub)category.
- Calculated the incremental growth in each industry by scenario. For each industry, we calculated how the scenario changes the share of customers in the NPS (sub)category, then multiplied that with the revenue potential of a customer in the respective (sub)category.
Most Industries Should Focus On Eliminating Detractors
The good news is that in all industries, promoters spend more than detractors. If that wasn’t the case for your organization, telling your story will be harder. Other key results are:
- When comparing the main scenarios 1–3, most industries get a higher benefit from turning detractors into passives. The exception are airlines and investment firms, which benefit more from moving passives to promoters.
- When looking at other scenarios, in two industries, moving strong detractors to moderate ones (scenario 7) is most attractive.
- And for a specific industry, such as multichannel banking, scenario 3 (detractors to passives) is most attractive. Scenario 6 (turning moderate promoters into strong ones) is the least attractive.
Apply This NPS Analysis To Your Own Business
Start right now and:
- Analyze your own data. Complete this analysis for your own customers, using your own data for two reasons: 1) Our models are created at the industry level and individual brands’ models may differ from those and 2) using your company’s data will secure more buy-in internally.
- Set better targets and prioritize improvements. Socialize your insights, then kick-start internal discussions on setting more differentiated targets, and direct any driver analyses you do on those customer groups that you want to move.
For details about our methodology, where the data comes from, and our calculations, see our report, How Customer Experience Drives Business Growth, 2024.
Categories